RRDtool is a great facility which aims to replace MRTG and was written by Tobias Oetiker. RRDtool provides powerful features for collecting and visualizing various system metrics like network traffic, MySQL counters or whatever you want. It’s always good idea to know what is going on under the hood of your server. Managing servers we prefer to monitor its parameters. Here is a short introduction into using RRD with Python. We will use Fedora 15 here but all examples should work in any another distributions as well. If you’re not familiar with RRD you might need to check its tutorial.
At the beginning we need to install RRD library for using with Python:
yum install rrdtool-python
Now we can create RRD database with all sources we need. Please note that here we use 30 minutes intervals, but you can use any you want. We use two parameters as data source: metric1 and metric2. It’s type is GAUGE. The thing is RRD supports different types (actually, Data Source Type): GAUGE, DERIVE, ABSOLUTE, COMPUTE or COUNTER. Probably, the most popular are COUNTER and GAUGE. The first one should be used for something like SNMP network interface counters for input and output traffic which increase constantly. And when you use just some parameters like HDD or CPU temperature you need to use GAUGE and RRD will gather data as is with no deltas. You can find other types description in RRD documentation.
#!/usr/bin/python
import rrdtool
ret = rrdtool.create("example.rrd", "--step", "1800", "--start", '0',
 "DS:metric1:GAUGE:2000:U:U",
 "DS:metric2:GAUGE:2000:U:U",
 "RRA:AVERAGE:0.5:1:600",
 "RRA:AVERAGE:0.5:6:700",
 "RRA:AVERAGE:0.5:24:775",
 "RRA:AVERAGE:0.5:288:797",
 "RRA:MAX:0.5:1:600",
 "RRA:MAX:0.5:6:700",
 "RRA:MAX:0.5:24:775",
 "RRA:MAX:0.5:444:797")
Let’s consider all lines in details. First line include name of RRD database (“example.rrd”) and you can use here any path you want, step of parameters checking (30 minutes in our case), and the start point (0 or N means ‘now’). ‘DS’ in line 4-5 means Data Source, these lines include two our metrics. ‘2000’ means that RRD can wait for 2000 seconds to get new values until it considers them as unknown (that’s is why we use 2000, which 200 seconds more of our 30 minutes interval). Last two parameters – ‘U:U’ – stand for min and max values of each metric (‘unknown’ in our case). Lines 6-13 describe what types of gained values RRD should store in its database. It’s pretty self-describing (average and max values). Mentioned values describe how many parameters RRD should keep. Considering it can be confusing I will omit explanation but note that these values were choosen to be compatible with MRTG (actually, it’s not quite true since we use 1800 seconds periods and not 5 minutes, so you might need to modify it (if you also don’t use 5 minutes period) or keep like I did).
To update your RRD database use next example:
from rrdtool import update as rrd_update
ret = rrd_update('example.rrd', 'N:%s:%s' %(metric1, metric2));

'N' also means 'now'. It should be launched every 30 minutes by cron, for instance. After some time RRD is ready to graph our data for a day, a week and a  month
import rrdtool
for sched in ['daily' , 'weekly', 'monthly']:

    if sched == 'weekly':
        period = 'w'
    elif sched == 'daily':
        period = 'd'
    elif sched == 'monthly':
        period = 'm'
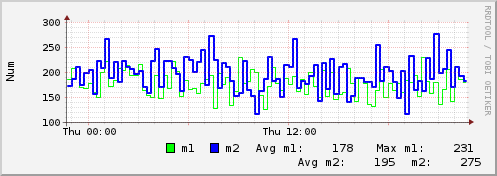
    ret = rrdtool.graph( "/var/www/html/metrics-%s.png" %(sched), "--start", "-1%s" %(period), "--vertical-label=Num",
         '--watermark=playground.in.supportex.net',
         "-w 800",
         "DEF:m1_num=example:metric1:AVERAGE",
         "DEF:m2_num=example.rrd:metric2:AVERAGE",
         "LINE1:m1_num#0000FF:metric1\r",
         "LINE2:m2_num#00FF00:metric2\r",
         "GPRINT:m1_num:AVERAGE:Avg m1: %6.0lf ",
         "GPRINT:m1_num:MAX:Max m1: %6.0lf \r",
         "GPRINT:m2_num:AVERAGE:Avg m2: %6.0lf ",
         "GPRINT:m2_num:MAX:Max m2: %6.0lf \r")
You should get something like:

Various visualized system metrics always help us to provide better services in server management. Of course, you could use munin or Ganglia. But in some cases it can not be acceptable or probably you don’t want to write your own plugins. That is where RRD can help.
Future reading
1. RRD tutorial by Alex van den Bogaerdt
2. Getting Started with RRDtool by Ben Rockwood (this document is old but brilliant, definitely must read).
3. RRDtool Documentation
Didn’t find the answer to your question? Ask it our administrators to reply we will publish on website.